names   = ["George", "Mary", "Frank", "Goliath", "Susanna"]
heights = [172, 163, 185, 199, 178] # in centimetres
weights = [139, 57, 52, 100, 83] # in kilogramsIntroduction to Python and Jupyter Notebooks
Introduction
This task introduces the use of Juptyer notebooks and Python through a data analysis exercise involving the calculation and plotting of a group of people’s body mass index (BMI). Using Jupyter required creating and saving a notebook, creating and editing markdown and code cells, executing code cells, and switching between command and editing modes. Python was used for the data analysis, including creating and manipulating lists, creating functions, code documentation, exception handling, printing with formatting and plotting using the Matplotlib library.
Data input
Create three lists of identical lengths containing the data required for the analysis from my friends. The data required are: - names: A list containing the names of the people (friends) as strings. - heights: A list containing the heights of each person in centimetres. - weights: A list containing the weight of each person in kilograms.
The data is now contained in three lists of identical lengths. The next step is to use this data to calculate the BMI for each person in the list.
Calculation of the Body Mass Index (BMI)
The traditional body mass index (BMI) formula is weight / height^2, where the weight is in kilograms and the height is in meters. The New BMI formula (Wikipedia, 2025) is 1.3 x weight / height^2.5, where the weight is in kilograms and the height is in meters. Given the weight and height, a function to calculate the BMI (calculate_bmi) is required. This function calculates the BMI using both the traditional and New methods. Before calculating the BMI values, the function conducts some data validation to ensure the passed arguments are convertible to floating point numbers and their value is greater than zero. The calculated BMI values are returned as a tuple.
def calculate_bmi(weight, height):
    """
    Calculates the BMI for a person given the weight (kg) and height (m) using the traditional and New methods.

    The formulae are:
        - Traditional BMI = weight/height^2
        - New BMI = 1.3 x weight/height^2.25

    :param weight: The weight of the person in kilograms.
    :param height: The height of the person in meters.
    :return: A tuple containing the traditional BMI and New BMI.
    """
    # Handle any input type errors
    # Check weight can be converted to a float
    try:
        weight_num = float(weight)
    except ValueError:
        print(f"Weight is not a number, the type provided is {type(weight)}")
        return None

    # Check height can be converted to a float
    try:
        height_num = float(height)
    except ValueError:
        print(f"Height is not a number, the type provided is {type(height)}")
        return None

    # At this point both input variables are known to be numbers. Now check they have the appropriate range.
    if weight_num <= 0:
        raise Exception(f"The persons weight must be greater than zero, the value provided was {weight}")
    if height_num <= 0:
        raise Exception(f"The persons height must be greater than zero, the value provided was {height}")

    # Calculate the BMI
    persons_bmi = weight_num/height_num**2
    persons_new_bmi = 1.3*weight_num/height_num**2.5

    return persons_bmi, persons_new_bmi
Iterate over the list of people and calculate their BMI using the standard and New BMI methods by calling the function calculate_bmi. The tuple returned from calculate_bmi is unpacked into the variables trad_bmi and new_bmi which are appended to either the bmis ornew_bmis lists.
bmis = []
new_bmis = []
for idx, name in enumerate(names):
    trad_bmi, new_bmi = calculate_bmi(weights[idx], heights[idx]/100)  # Note: the height is converted from centimetres to meters
    bmis.append(trad_bmi)
    new_bmis.append(new_bmi)
We now have two lists, bmis and new_bmis, containing the calculated BMI values for each person for each calculation method.
Categorisation of BMIs
Each person’s BMI can be placed into one of four categories: underweight, normal, overweight, or obese (Wikipedia, 2025). This is achieved with a helper function categorise_bmi. The function also returns a list of colours that can be used when plotting the data.
def categorise_bmi(persons_bmi):
    """
    For a given persons BMI value, categorise it based on the World Health Organisation (WHO) categories and assign a colour for plotting.

    The categories and colours are:
        - "underweight", BMI < 18.5, colour="tab:blue"
        - "normal", 18.5 <= BMI < 25.0, colour="tab:green"
        - "overweight", 25.0 <= BMI < 30.0, colour="tab:orange"
        - "obese", BMI >= 30.0, colour="tab:red"

    :param persons_bmi:
    :return: tuple containing strings for the WHO category and the plot colour.
    """
    if persons_bmi < 18.5:
        return "underweight", "tab:blue"
    elif persons_bmi < 25.0:
        return "normal", "tab:green"
    elif persons_bmi < 30.0:
        return "overweight", "tab:orange"
    else:
        return "obese", "tab:red"
Results
The BMIs for each person in the input data can be tabulated by iterating over the calculated BMI data using a for loop to print one line for each person, as shown in the below output.
# Find the longest name so the spacing can be adjusted when printing
name_padding = max(map(len, names))

bmi_colours = []
for idx, bmi in enumerate(bmis):
    # Get BMI category and plotting colour
    bmi_category, bmi_colour = categorise_bmi(bmi)
    bmi_colours.append(bmi_colour)
    print(f"## {names[idx]:{name_padding}} has BMI of {bmi:4.2f} which is {bmi_category}. The New BMI index is {new_bmis[idx]:4.2f}")
## George has BMI of 46.98 which is obese. The New BMI index is 46.57
## Mary has BMI of 21.45 which is normal. The New BMI index is 21.84
## Frank has BMI of 15.19 which is underweight. The New BMI index is 14.52
## Goliath has BMI of 25.25 which is overweight. The New BMI index is 23.27
## Susanna has BMI of 26.20 which is overweight. The New BMI index is 25.53This output shows that the New BMI is higher for Mary (categorised as normal) and lower for each other person, not classified as normal, than the traditional formula’s value. The New BMI formula uses an exponent for the height of 2.5 to better represent the scaling of mass with volume, which has an exponent of 3. This is an advantage of the New BMI formula as it better represents the scaling od mass with height. The factor of 1.3 is used to align the New BMI result with that of the traditional formula for people of average height. Therefore, the New BMI value will be lower for people with above-average height and higher for people with below-average height compared to the traditional formula’s value. The New BMI formula has similar limitations to the traditional BMI, which is discussed below.
Finally, we can visualise the data using a bar plot. In the plot, each bar represents one person; the height of the bar signifies their BMI value, and the colour of the bar represents the WHO categorisation of the person’s BMI.
import matplotlib.pyplot as plt
plt.bar(names, bmis, color=bmi_colours)
plt.title("My Friends' BMIs")
plt.ylabel(r'BMI $\left(\frac{kg}{m^2}\right)$')
plt.show()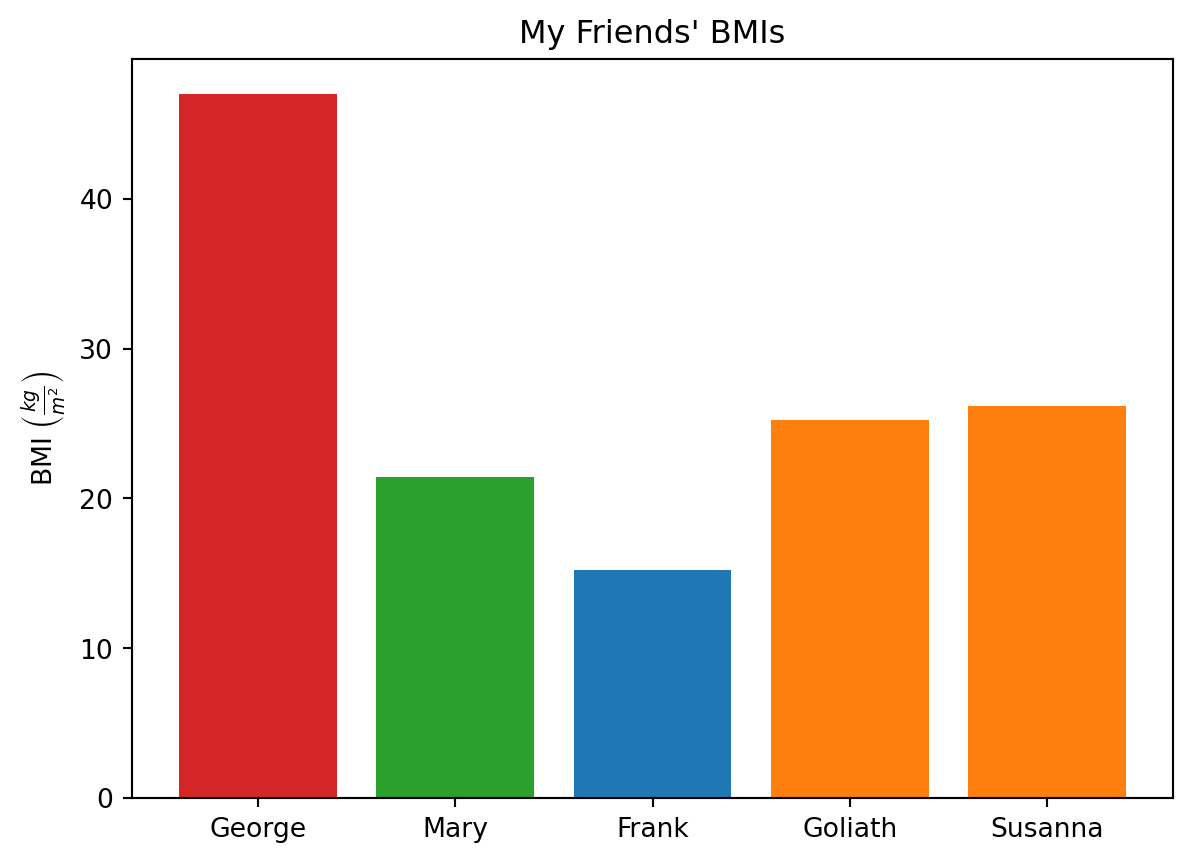
The bar chart shows my friend’s BMI values range from approximately 17 to 47. Frank has the lowest BMI and is categorised as underweight, while George is classified as obese, with his BMI being greater than 30. Mary is the only person that has a normal BMI.
Limitations and Benefits of BMI
BMI suffers from several limitations from both the medical and societal perspectives.
Medical limitations of BMI are numerous: - The calculation does not take into account variations between genders or races, as it was initially developed for European men (Wikipedia, 2025). It assumes that the relationship between weight and height is fixed irrespective of race or gender. - It does not account for body composition (fat, muscle, bone and water). - It does not distinguish between muscle and fat mass. Two people with the same height and mass but different muscle and fat percentages will have the same BMI. However, the individual with the higher muscle percentage is likely to have lower health risks but can still be identified as at risk based on their BMI.
- It does not account for changes due to aging, such as loss of height (Wikipedia, 2025), changes in bone density, or body composition. It assumes a simple scaling between weight and height with disregard for other physical characteristics such as waist, wrist, and neck circumferences.
In a societal context, the BMI can result in stigmatisation and labelling of individuals as “obese” or “overweight”, impacting their self-esteem and overall health.
Two of the most common misuses of BMI are: - An overemphasis on weight loss targeting the “normal” category rather than promoting overall health. - It can become the sole criterion for diagnosis rather than considering other factors such as an individual’s body composition, muscle mass and physical characteristics.
Despite its limitations, BMI provides medical practitioners with a convenient and easy-to-calculate measure from readily available measurements (a person’s weight and height) that can be used to identify people who may be at risk of developing obesity-related conditions. Additionally, it can inform public health decisions.
Summary
This Jupyter Notebook demonstrates how to use Jupyter Notebooks and Python to conduct a data analysis exercise involving calculating and plotting a group of people’s body mass index (BMI) using the traditional and New BMI formulae. The limitations and benefits of BMI were discussed.
Possible extensions to the data analysis include: - De-identify the people by allocating a unique ID. - Further data should be added to allow segregation based on gender. - Consider alternate forms of BMI measure to overcome some of the limitations discussed above, such as the inclusion of waist measurement.
References
Wikipedia. (2025, March 6). Body Mass Index. https://en.wikipedia.org/wiki/Body_mass_index